After about 30 hours it looks as though data is finally available in my Google Analytics account, and I can take a proper look at the reports. The reporting site only mentions a 12 hour delay in the data being made available, but since this is a new offering, and a popular one at that, I guess we should give Google a bit of a break. After all, they are providing a free tool that isn't half bad. Anyway, on to the reports!
Note: you can click the images in this article to see larger versions in a new window.
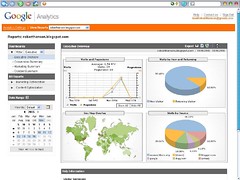 When you log into the tool you are presented with a list of profiles that you have created. You can create as many profiles as you need, typically you will have one profile per site. The image to the right is the main entry page after selecting a profile, and gives you an overview of the traffic on your site. On the left navigation area are a list of reports that can be run on the data. You may use the drop-down menu of roles to change the list of available reports. The roles listed are "Executive" for summary style reports, "Marketer" for reports on campaigns, goals, and conversions. The last role is "Webmaster", which resents reports on browser types, flash versions, Java support, connection speed, and other useful data.
One of the nice features is the map that you see here in the bottom half of the main page, where it shows you what geographic locations your traffic is coming from. For this profile this information isn't all that useful, but it can become important if you are selling a product and need to know where your users live. I was surprised though to see visitors coming from as far away as Norway, Alaska, and Brazil.
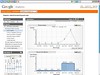 Page Views: You can track page views (daily and hourly) basis, as well as visits (hopefully less than the page views), user loyalty, goal and conversion tracking, etc. It is hard to tell, but it seems that doesn't compare your recent numbers against historical values. This is useful so that you can compare this week's numbers to last week's numbers, and even last year's numbers. These features if required can be found on competing systems, although it is unlikely that they will ever be free.
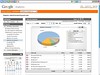 The referral report is one of the more important reports from my point of view. It shows you where your users are coming from, which could be Google, some other site, or maybe they are coming to your site directly. For me this report showed me that about 60% of my traffic was coming from researchbuzz.org. Someone who contributes to that site wrote a article on Google Analytics, and referenced an article here for additional information. It is nice to see references like this, and gives you a better understanding of how your audience finds you.
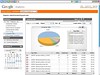 The "Content by Titles" report lists the top pages on your site, along with the number of visits, views, average times, and exit percentages for each page. In this report it looks like the Google Analyitics article that I wrote the other day recieved the most attention, which makes sense based on the referral report we just saw. For this page it is showing an average view time of about 3 minutes, with a high exit rate. Again, it makes sense since most of the visitors only came to read the information about Google Analytics.
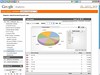 This report is typical of a lot of the "technology" reports that Google Analytics supplies. This one in particular is showing what version of Flash my visitors are using. This is especially important if you use Flash on your site. The last thing you want to do is put a Flash 8 movie on your site if only 20% of your users have already installed this version. Users typically don't like it when they visit a web page and need to upgrade a plugin, change their monitor resolution, change their color depth, or install a different browser to view your content. All of this information is available here, and with this data you can make sure that your site is usable by your audience.
In summary, Google Analytics is nice for a site with small to moderate traffic. It has a large number of reports which are easy to navigate. It contains a lot of cool features for marketers, including goal tracking and conversion rates. All of this is delivered by Google for the bargain price of $0 as long as you report less than 5 million page views per month. For sites that recieve more traffic than this, you may be better off with an alternate solution depending on your budget. Sometimes you really need to know how much traffic you have now, and not 12 hours from now. Sometimes you have sepecific marketing concerns that require additional report types. Perhaps these features will be available in the "pro" version of Google Analytics, that I can't say for sure. What I can say is that I like it, thanks Google.
1 comment:
Post a Comment